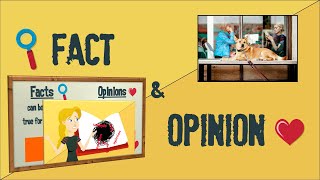
Fact and Opinion Anchor Charts for 1st Graders: A Practical Guide
Teaching first‑grade students to differentiate between facts and opinions is a foundational skill that supports reading comprehension, writing, and critical thinking. Anchor charts—visual references that stay on classroom walls—provide a clear, reusable tool for reinforcing this distinction. This article explains how to create effective fact‑and‑opinion anchor charts, how to use them in daily lessons, and why they strengthen students’ language development.
Why Anchor Charts Matter in Early Literacy
In the early grades, children are still learning the language of academic discourse. An anchor chart offers a constant visual cue that helps them learn how to distinguish factual statements from personal viewpoints. When a chart is displayed prominently, students can refer to it independently, fostering confidence and reducing reliance on teacher prompts.
Key Components of a Fact‑and‑Opinion Chart
A well‑designed chart includes the following elements:
- Simple definitions: Use age‑appropriate language, such as “A fact tells something that is true. An opinion tells what someone thinks.”
- Color‑coded symbols: For example, a blue checkmark for facts and a red thought bubble for opinions.
- Examples: Provide short, relatable sentences that first‑graders can recognize in everyday conversation.
- Guiding questions: Include prompts like “Can I prove this?” for facts and “Do I feel this way?” for opinions.
How to Tell Fact from Opinion: Classroom Strategies
Use the anchor chart as a reference point during read‑alouds and writing activities. Follow these steps to help students practice distinguishing:
- Read a sentence aloud and ask, “Is this a fact or an opinion?”
- Encourage the child to point to the chart and identify the appropriate symbol.
- Discuss why the sentence fits that category, using the guiding questions on the chart.
- Record the student’s answer on a sticky note and attach it to the chart for visual reinforcement.
Sample Sentences for First‑Grade Anchor Charts
Below are sample sentences that illustrate the difference. Teachers can write these directly on the chart or use them as flash cards during lessons.
- Fact: The sky is blue.
- Opinion: The sky looks beautiful.
- Fact: There are 365 days in a year.
- Opinion: Winter is the best season.
- Fact: Dogs have four legs.
- Opinion: Dogs are the friendliest pets.
Integrating Video Resources
Many teachers find that short video lessons reinforce the concepts displayed on the anchor chart. In this video, you’ll learn the difference between a fact and an opinion through animated examples and a