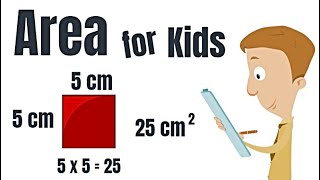
Perimeter And Area Anchor Charts: A Quick Reference for Teachers and Students
Anchor charts are visual tools that help students remember key concepts and steps for solving problems. When it comes to geometry, perimeter and area anchor charts are especially useful because they break down the formulas and procedures into easy‑to‑read, step‑by‑step guides. This article explains why these charts matter, how to create them, and how to use them in the classroom. We’ll also point you to free resources, including a video lesson from the Secret Class Dojo and the Mathantics website.
Why Use Perimeter and Area Anchor Charts?
Students often struggle with the difference between perimeter (the total distance around a shape) and area (the amount of space inside a shape). Anchor charts clarify:
- Conceptual understanding – Visual cues reinforce the distinction between “around” and “inside.”
- Procedural memory – Step‑by‑step formulas become second nature.
- Classroom efficiency – One chart can replace multiple explanations and reduce repetition.
- Student confidence – When the steps are visible, students are more likely to attempt and solve problems independently.
Key Elements of a Successful Anchor Chart
Below is a checklist of items to include in your perimeter and area anchor charts:
- Shape names and symbols – Label each shape (square, rectangle, triangle, circle) with its common symbol.
- Formulas – Write the equations in large, bold type.
- Step‑by‑step instructions – Break each formula into numbered steps.
- Illustrations – Draw the shape with labeled sides and dimensions.
- Examples – Provide a worked example next to the formula.
- Common pitfalls – Note mistakes students often make (e.g., using the wrong unit).
- Color coding – Use colors to differentiate perimeter (e.g., blue) from area (e.g., green).
Sample Perimeter Anchor Chart
Square
- Perimeter = 4 × side
- Step 1: Measure one side.
- Step 2: Multiply by 4.
- Example: If side = 5 cm, perimeter =


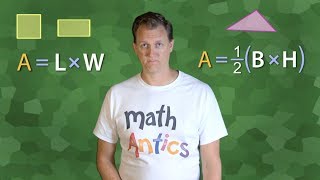


![🎵 Perimeter and Area Song 🎵 - [3rd, 4th, & 5th]](https://i.ytimg.com/vi/M_jJ3NPdWPI/mqdefault.jpg)