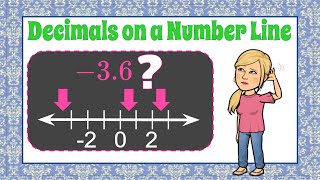
What Is a Number Line?
A number line is a straight, horizontal (or sometimes vertical) line that represents real numbers in order. The line is divided into equal intervals, with zero at the center, positive numbers to the right, and negative numbers to the left. This simple visual tool helps students understand concepts such as magnitude, direction, and the relationship between integers, fractions, and decimals.
Why Plotting on a Number Line Matters
Being able to plot on a number line is more than just a classroom exercise. It builds a foundation for algebraic thinking, supports problem‑solving in geometry, and clarifies the meaning of absolute value. When learners see numbers positioned in space, they can compare sizes quickly, estimate sums and differences, and develop intuition for operations with negative numbers.
Step‑by‑Step Guide to Plot on a Number Line
1. Identify the Scale
Choose a scale that matches the numbers you need to plot. For whole numbers, a scale of one unit per tick works well. For fractions or decimals, you may need a finer scale such as ½ or 0.1 per tick. Consistency is key: every tick should represent the same distance.
2. Mark the Zero Point
Locate the central point of the line and label it 0. This anchor point separates positive values (to the right) from negative values (to the left). All other markings are measured from this zero reference.
3. Locate Positive and Negative Values
Starting from zero, count rightward for positive numbers and leftward for negative numbers. For example, to plot +4, move four ticks to the right; to plot ‑3, move three ticks to the left. Use arrows at both ends of the line to indicate that the line extends infinitely.
4. Plot Fractions and Decimals
If the scale includes fractions, place the point between the nearest whole‑