Understanding the ROC Curve in Diagnostic Testing
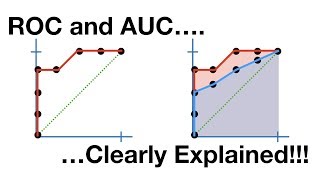
The Roc Curve Diagnostic Test is a fundamental tool for evaluating the performance of medical and laboratory tests. ROC stands for Receiver Operating Characteristic, a term borrowed from signal detection theory that has become a staple in biostatistics and clinical research. By plotting the true‑positive rate (sensitivity) against the false‑positive rate (1 – specificity) across a range of thresholds, the ROC curve visualizes how well a test discriminates between diseased and non‑diseased subjects.
Why ROC Curves Matter
Figures and curves are common in biostats, and the ROC curve offers several advantages:
- Threshold independence – It evaluates the test over all possible cut‑offs, not just a single chosen value.
- Comparison of multiple tests – The area under the curve (AUC) provides a single metric to compare diagnostic accuracy.
- Clinical relevance – By selecting points on the curve, clinicians can balance sensitivity and specificity according to the disease context.
Key Components of an ROC Curve
When you create an ROC curve, you will typically see the following elements:
- Sensitivity (True Positive Rate) – The proportion of actual positives correctly identified.
- 1 – Specificity (False Positive Rate) – The proportion of negatives incorrectly classified as positive.
- Diagonal line – Represents a test with no discriminative ability (AUC = 0.5).
- Curve above the diagonal – Indicates better than chance performance; the farther the curve from the diagonal, the higher the AUC.
Interpreting the Area Under the Curve (AUC)
The AUC quantifies overall test accuracy. General guidelines are:
- 0.90 – 1.00: Excellent discrimination
- 0.80 – 0.90: Good discrimination
- 0.70 – 0.80: Fair discrimination
- 0.60 – 0.70: Poor discrimination
- 0.50 – 0.60: No discriminative power
It is important to remember that a high AUC does not guarantee clinical usefulness; the chosen operating point must align with patient‑centered priorities such as minimizing missed diagnoses or reducing unnecessary treatment.
Applying ROC Analysis to Multiple Diagnostic Tests
If you have multiple biomarkers, imaging scores, or algorithmic outputs, you can generate separate ROC curves for each and compare their AUCs. In practice, this often involves